Admin documentation
This document describes administration of the CELUS application. For user documentation see User documentation.
System configuration
Defining report types
Report types are not hard-coded in the CELUS codebase, but rather defined in the database. This allows flexible creation of new report types, especially in case of custom manually uploaded data. The following steps describe how to create a report type from scratch. You may also use existing report types as inspiration when creating your own data types.
Creating report type
Report types are available in the Django admin interface in the Logs > Report types section. To create a new report type, use the Add report type button in the upper right corner of the above mentioned page.
You will be presented with a dialog similar tot he following:
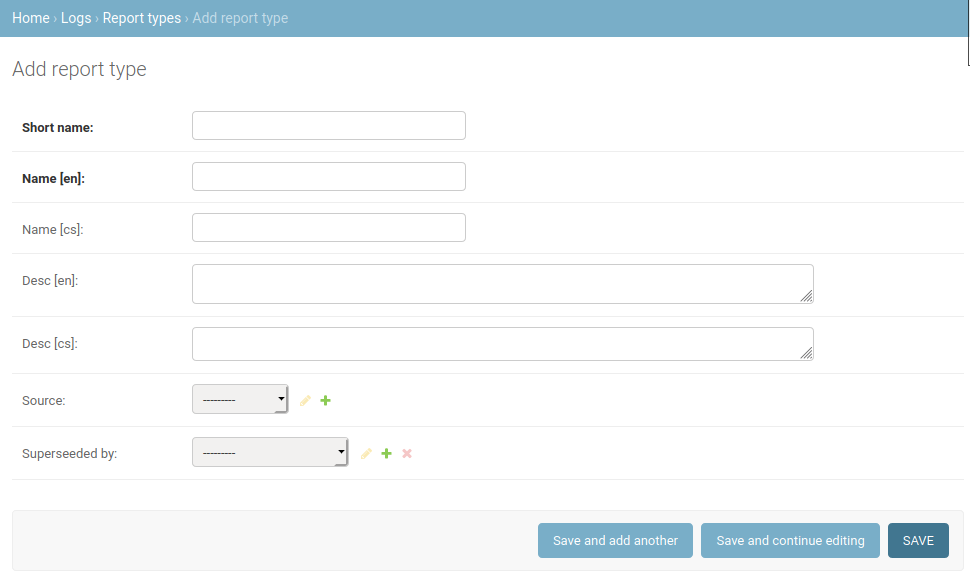
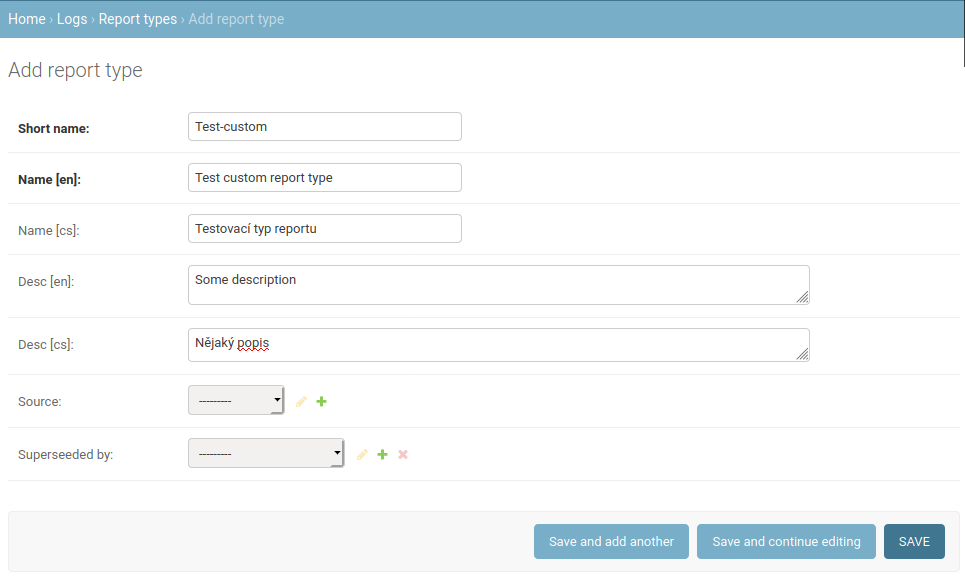
Fill in the basic information about the report type. The Short name is used in some drop down menus in Django admin, etc., so use something short but obvious and easily recognizable. The Name is present in several language versions. You should fill in at least the English version. The Name is used when presenting this report type to the user, so make it clear. The description can be used to further obviate the meaning and purpose of this report type.
You do not have to fill the Source. The Superseeded by attribute is used when you have the same data available from different report types and you want to make sure that only the newest version is used when computing interest. You would probably leave it empty in most cases, but it is useful when specifying that COUNTER 4 reports are superseeded by COUNTER 5 reports and interest data should be preferentially calculated from version 5.
When filled in, submit the form by clicking on Save in the lower right corner.
Now we have the report type created, but this is only the beginning. We have to tell CELUS how the data for this report should be saved and also presented to the user.
Adding dimensions to the report type
Depending on the nature of the report type, each data point can have many dimensions, such as the date, title name, publisher name, name of metric, type of user accessing the e-resource, etc. In order for CELUS to be able to properly import the data from a source file, it has to know about these dimensions.
Some of the dimensions are implicit and do not have to be specified. These are:
date
title
organization
platform
metric
Other dimensions used by that report type, if any, must be added to the report type in the Django admin.
When adding a new dimension that is not used by any other report type, the dimension has to be created. You can do so in the Django admin in section Logs > Dimensions by using the Add dimension button in the upper right corner.
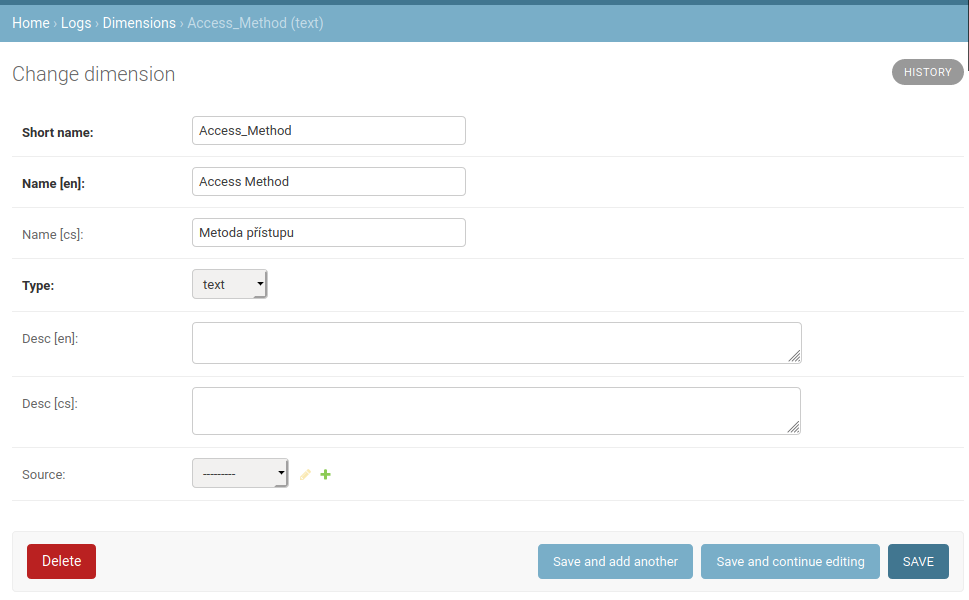
- Short name
the value as it appears in the source files - that is in COUNTER report or as column headers in the tables that you upload to CELUS.
- Name
localized name of the dimension as it appears to the user.
- Type
textfor most data, but for integer dataintegertype is preferential.- Desc
Description of the dimension. It may be useful for other admins. It is not displayed to the user.
You can leave the Source field empty.
When all dimensions are associated with a report type, it is ready for users to upload data of this type. However, to visualize the data, more has to be done.
Creating a report data view
A report type (described above) describes how data are read from a source file and how it is stored in the database. To make the presentation of the data more flexible, CELUS uses “report data views” which define one of more different views of the underlying report type data.
In order to make a report type accessible in the user interface, at least one report data view has to be created for it.
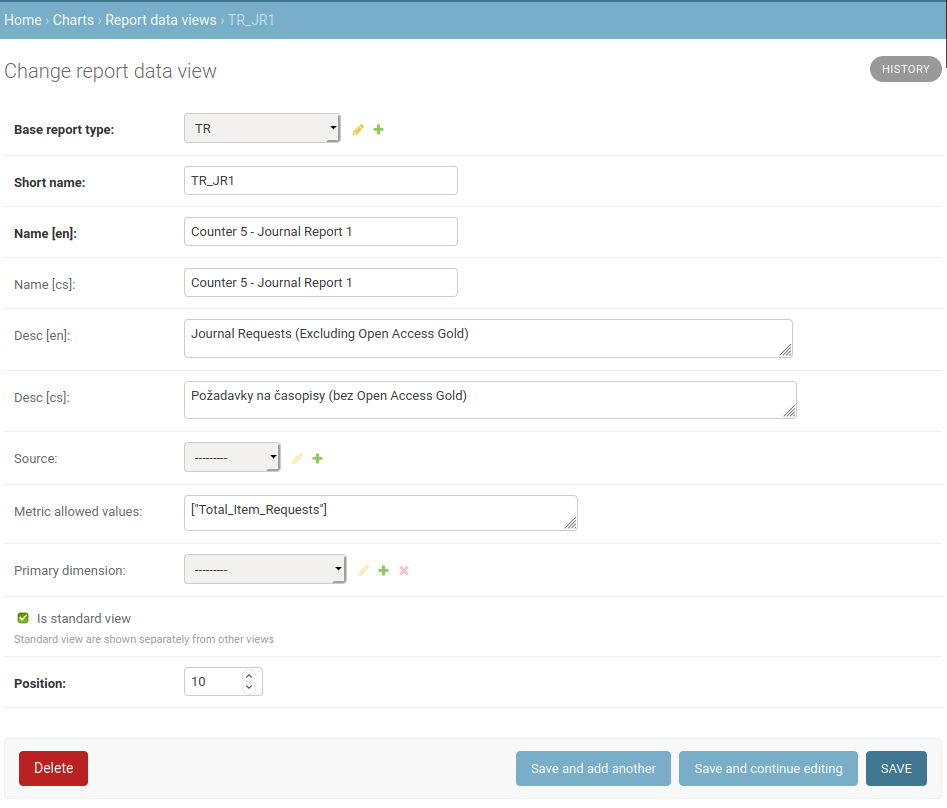
Report data views are created in the Charts > Report data views part of the Django admin. In the screenshot below, you can see the definition of view which creates JR1 view from the underlying COUNTER 5 TR master report.
The meaning of each attributes is as follows.
- Base report type
The report type for which this view should be used - defines the underlying report type.
- Short name
Mostly internal short version of the report view name - used in some dropdown menus in the admin, etc.
- Name
Localized version of the view name - this is the name users see in the UI.
- Desc
Localized version of the description of the view - it is presented in some places of the UI together with the name.
- Source
You can leave this empty
- Metric allowed values
If the view should not present all metrics from the underlying report, but only some of them, you can list them here
["Metric one", "Metric two"]. This is a list in the JSON format, so please be careful about the proper formatting of data. To allow all metric values, use empty list ([]). If any values are present in the list, only these metrics will be shown.- Primary dimension
A remnant of a previous version kept only for backwards compatibility. Not used anymore
- Is standard view
When checked, it means this view will be presented to the user in a dropdown menu in section “Standard views”. Otherwise it will be shown in the following section. This option is usually checked.
- Position
A relative number which is used to sort the views in the dropdown menu presented to the user. Please note that the numbers are only relative, so it does not matter if the number is 10 or 10000, the only thing that matters is the size of the numbers relative to other views. Please note as well that only views for which there are any data on a specific page are presented to the user. This means that for example COUNTER 5 views are not shown to users on platforms which only have COUNTER 4 data.
Note that there may be more than one view of the same report type data. For example all the TR_JR1, TR_BR1 and other reports in COUNTER 5 are created in this way in CELUS from the underlying COUNTER 5 TR master report.
When you save a report data view definition, you are ready for the last part of making the data available to the user.
Associating charts with report data views
The last step in making a new report type available to users is to tell CELUS which charts should be presented to the user if he selects the report data view (see above) associated with the report type.
To define the list of charts for a view, you need to visit Charts > Report view to chart types where you will find a list of already created associations. To create new one, click on Add report view to chart type in the upper right corner and fill in the form as shown below:
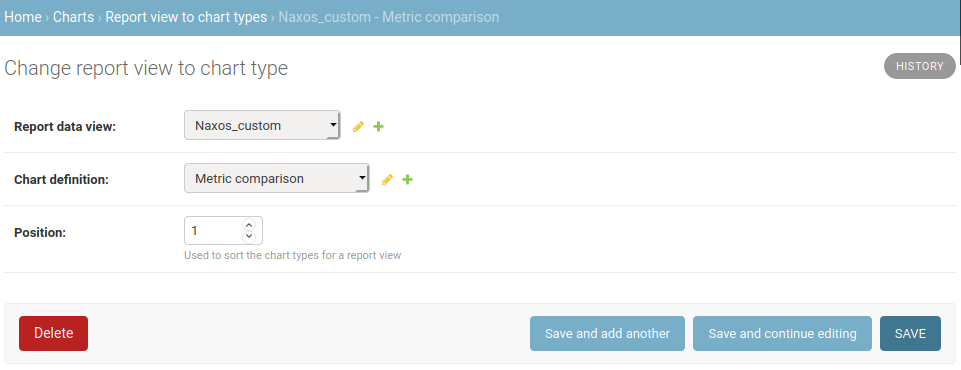
- Report data view
Select the report view for which you want to make a chart available
- Chart definition
Select one of the existing chart definitions. (You can also create new one yourself and then return back here if none of the existing suits you.)
- Position
A relative number which defines the order of charts in which they are presented for the report view at hand.
Once you fill in the data and save the definition, the user will be able not only to view the report view name in the selection of available reports for matching platforms, but also to choose from available charts after he selects it.
Creating chart definitions
Charts definition describes what a chart presented to the user should look like. It describes how the underlying data should be presented.
To create or modify a chart definition, go to the Charts > Chart definitions part of the Django admin. There you will see a list of the already defined charts and also have the possibility to create a new one.
By clicking Add chart definition in the upper right corner, you will be presented with the following form:
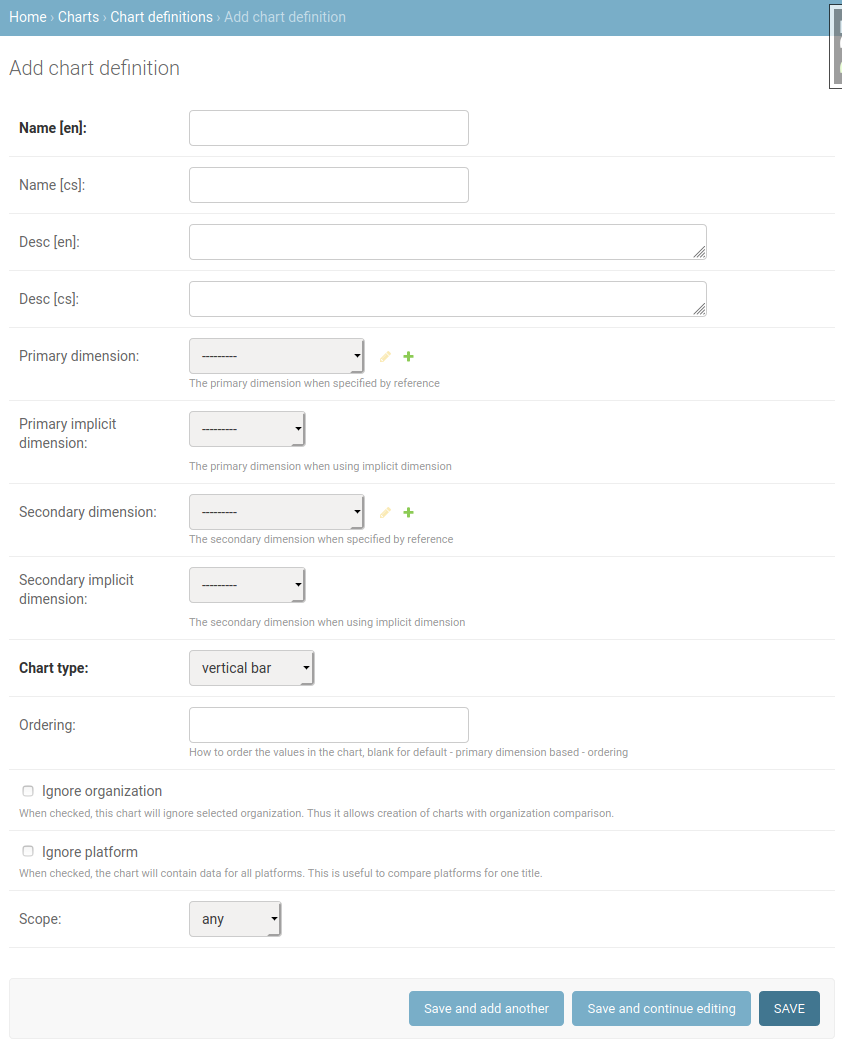
- Name
Localized name of the chart - this will be presented to the user
- Desc
Localized description of the chart - this will be shown as a tooltip to the user.
- Primary dimension & Primary implicit dimension
These two values define what the primary dimension - X axis - should be for the charts. If the dimension should be one of the built-in (implicit) ones, than the Primary implicit dimension value is set. Otherwise use the Primary dimension and select the corresponding dimension.
- Secondary dimension & Secondary implicit dimension
Similarly to the case of primary dimensions, these two attributes together define the secondary dimension of the chart. This means different series into which the data is subdivided.
- Chart type
Select one of the available types of chart.
- Ordering
By default the data in the chart are ordered naturally by the primary dimension. However, if you would like to have a different ordering, you can set it up here. It has to be a name of one of the dimensions. For example, you can use
countto order data by the largest value.- Ignore organization
Normally a chart shows data for a specified platform/title and organization. If you would like to create a chart that compares different organizations, you can check this box. Please note that if the user does not have access to the presented organizations, the organization’s name will be anonymized.
- Ignore platform
Similarly to Ignore organization this allows creation of charts which span multiple platforms. This can be used to create a chart which compares different platforms from which a title is available.
- Scope
Where should this chart be displayed. It may be either platform for charts displayed on the chart detail page, title for those on title detail page, or any for those presented on both.
Once you fill in the parameters of your chart and save it, you will be able to associate it with specific report data views and use if for data presentation to your user.
Adding a new platform
The list of platforms is periodically synchronized with the external ERMS system, so in order to add a platform, you need to do it there.
It is also possible to add a new platform using the Django admin. You can find it in section Publication > Platforms. In order for the platform not to be deleted during the next ERMS synchronization, you need to let the Source attribute empty.
When a new platform is added, it means that it will be available in different menus throughout the system, it will be visible in the platform list for admin users, etc., but there will be no data and no interest definition.
Create SUSHI credentials
If you want to download data over SUSHI for the newly added platform, you need to add the corresponding SUSHI credentials into the system. The method is thoroughly described in the user documentation - Setting up, editing and debugging SUSHI.
Define interest for a platform
Because platforms differ in their content, there is no “one size fits all” definition of interest for all of them. Instead interest has to be defined for each platform individually. This means telling CELUS which report types should be used to compute interest data for that platform - for example it might be the COUNTER 4 BR2 report for one platform and the COUNTER 4 JR1 report for another - depending on that kind of content is available on that platform and how it is used by the consortium.
More information about defining interest is available in Working with interest.
NOTE: You can find a list of platforms without interest definition under the Maintenance label of the navigation sidebar. If any such platforms already contain data, they will be highlighted as it is most important to define it for these.
Working with interest
This section describes how interest works behind the scenes and how to work with it to get the desired result. For more generic information about interest please see Interest - what it means and how to interpret it.
How is interest defined
As a compromise between flexibility and maintainability, CELUS uses a two tiered approach to defining interest.
Each platform defines a set of reports which should be used to calculate interest for that platform. This makes it possible to distinguish between different types of platforms and their focus on different types of content.
For each report type a set of metrics is selected which define the interest for that particular report type. For example you can decide that from the COUNTER 5 TR report the metric “Unique_Item_Requests” will be the best measure of interest for your particular use, but other consortia might use the “Total_Item_Requests” metric instead.
Platform specific interest calculation
Even though different interest types make the interest system pretty flexible, it is also sometimes desired to be able to make specific adjustments to how interest is calculated for specific platforms. This is especially true for platform which do not offer COUNTER data and report types have to be tailor made for them. In such case CELUS cannot guess how to extract the interest data without explicit instructions from the user.
To accomplish the above, we decided to make it possible (and necessary) to assign specific reports to a platform as “interest defining”. There may be more than one such report type - e. g. COUNTER 4 BR2 and COUNTER 5 TR reports.
To tell CELUS which reports should be used to calculate interest, you should create corresponding record under Publications > Platform interest reports. The only two required input values are Report type - the name of the report - and Platform - the platform you wish to associate the report type with.

You can associate more than one report type with a platform. Also one report type may be connected to more than one platform. In fact many platforms use the same set of report types for interest calculation.
Defining interest for new report types
Maintenance
Removing unsuccessful SUSHI downloads
CELUS tries to be smart about downloading data using the SUSHI protocol. It does not re-fetch data for platforms and months for which data was already successfully retrieved or for which there were too many unsuccessful attempts.
This “intelligence” can sometimes become unwanted, for example when a platform releases corrected data after fixing an error on their side or when access is finally fixed after many unsuccessful attempts (e.g. when an IP address is finally added to the providers list of allowed addresses).
In these cases the previous downloads (or attempts) block the correct data from being downloaded and it is necessary to remove them for the system to redownload the data.
This can be accomplished using the Django admin interface.
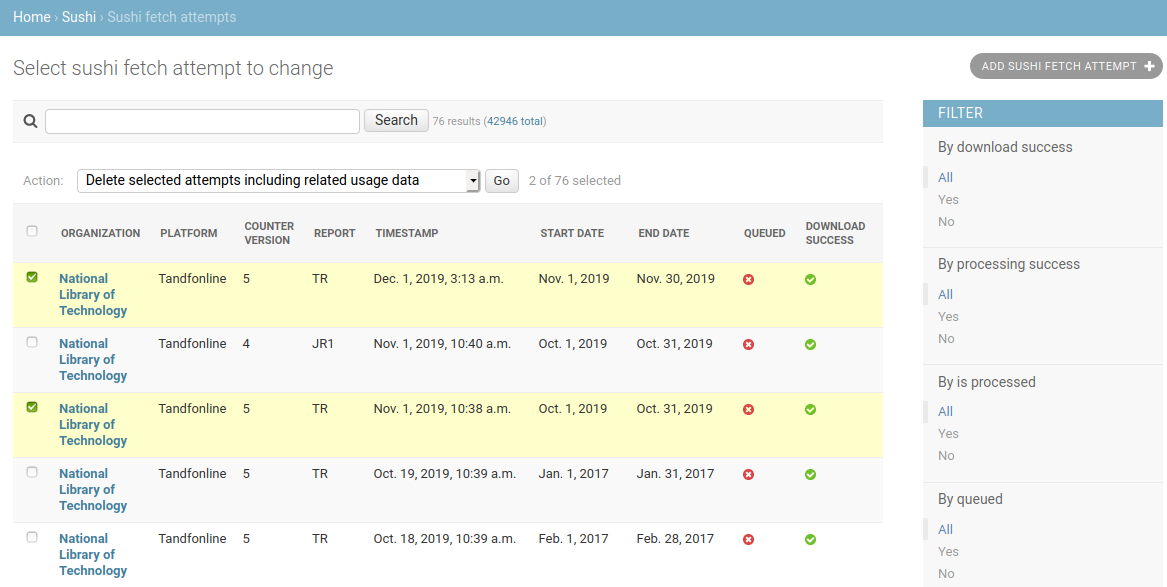
Navigate to the SUSHI app and click on the link to Sushi fetch attempts. Here all attempts to fetch SUSHI data are stored - regardless of their success.
In the list of Sushi fetch attempts use the right-side panel to filter the fetch attempts to the desired set. The organization and platform filters are most likely to be useful.
Once you have the list of attempts narrowed down to the desired platform and organization (and possibly using other criteria), check the checkmark on the left of each of the attempts you wish to delete and select the action Delete selected attempts including related usage data from the dropdown menu at the top of the table. Then press the Go button just to the side of the dropdown.
Once you have deleted the corresponding SUSHI fetch attempts, the system will automatically try to re-download the data for the organizations, platforms and dates you have just cleared up.
The download will take place in the next scheduled download window. The specific timing depends on your system settings.